The one big A/B testing mistake marketers need to stop making
If you’re performing A/B split testing for marketing, whether for your landing pages or ads, there’s a good chance that you may be declaring the wrong winner. This article will help guide you during the process of A/B testing in addition to highlighting the two biggest A/B testing mistakes marketers make so that you can learn from them without making the same errors.
By the end of this article, I hope you’ll understand the importance of two things: defining a sample size and choosing a set end date. When you have a firm grasp of these two things, you will be able to trust that your results are accurate.
I’ve run a lot of A/B tests in the past and have made every mistake I highlight in this article along the way. By learning from these mistakes, and sharing what I’ve learned with you, I hope to unleash your full potential when conducting your own A/B testing in addition to gaining some insight about A/B testing terminology and concepts.
We’ll cover:
- Why you need to understand A/B testing statistics
- Mean, variance, sampling
- Null vs. Alternative hypothesis
- Type I and Type II errors
- Statistical significance and statistical power
- Intervals and margin of error
- Things to look out for
- How to put all the pieces together
Why do we need to understand A/B Testing statistics?
Do we really need to know statistics principles to be effective marketers? They may feel overly theoretical and not all that useful, but I assure you they’re invaluable for producing results that are truly accurate. And I promise that it’s not as confusing or difficult as you may think.
A/B testing is an essential and powerful tool to have in your marketing toolkit. But there’s no point in running an A/B test if you don’t understand the key performance indicators of A/B testing. A lack of understanding is guaranteed to result in confusing and misleading results, so it’s important to get a solid grasp on A/B testing statistics.
Imagine trying to optimize a Google Ads campaign, but not knowing what CTR, Conversion Rate, or Impression Share mean. You wouldn’t have any idea where to start, what’s working, and what isn’t. Similarly, how are you going to know what conversion method works better if you don’t know what statistical significance or statistical power means?
People get scared by the word “statistics,” but statistical significance, p-values, and statistical power are all KPIs, just like CTR, CVR, and impression share. Using them in the decision-making process is essential for running impactful A/B tests.
So, what’s the problem with how marketers test right now? Generally speaking, marketers blindly follow the tools, like Google Optimize or Optimizely, that they use. They throw two landing pages against each other, wait until the tool says the results are “statistically significant,” and stop the test without knowing what that phrase truly means. If you don’t know what these metrics mean, it’s impossible to figure out what aspects are working and what aspects may be hindering your page’s performance.
When an A/B testing software tells you one landing page has a higher conversion rate than another, and the results are “statistically significant,” it’s assuming that the tester has preset a sample size. If you don’t preset the sample size (which many marketers don’t), the term “statistically significant” becomes irrelevant and useless. Sample size, or the number of observations of a test, is a variable used in the equation for statistical significance, so choosing a sample size at random (i.e., ending your test at a random time) is pointless. Imagine if Google used a random number of impressions to calculate your campaigns CTR — the metric would instantly become meaningless to your specific situation.
Mean, Variance, and Sampling
Let’s define some standard terms.
Mean: We all know this term; it’s the average. To obtain the mean, add up the results and divide by the number of results.
In A/B testing, the conversion rate of each variant you see is the average conversion rate.
Variance: How far a set of results is from the mean.
Here’s an example: If 70% on a test is the mean, the highest score was 100%, and the lowest score was 40%, the variance will be +-30.
Sampling: Since we can’t conceivably record and measure every single result, we pick a random sample from the entire population of results.
The larger your sample, the more representative of the whole it is. There are many calculators that will help you choose how big of a sample size you must use to get a result you can trust.
Null versus Alternative Hypothesis
Imagine we’ve had a landing page running for a while, and we want to test it against a new landing page.
Null Hypothesis: The default version that is being tested against. The original landing page is the Null Hypothesis in this case. It is also known as the control. The null hypothesis in the example above would be, “The original LP (landing page) will perform better than the new LP.”
The Alternative Hypothesis: The version we think will perform better than the original. In this case, that is the new landing page we’re testing. The alternative hypothesis is “If we change this element on the landing page, the conversion rate will improve by X%.”
Type I and Type II errors
Understanding Type I and Type II errors will help you follow conversion rate optimization best practices and avoid common A/B testing mistakes. These terms are important because they tie to statistical significance and power, which we’ll define later.
Type I error: When you incorrectly reject the null hypothesis. In simple terms, when you conclude that the new landing page converts better than the original when it doesn’t (a false positive).
Tools and calculators can say something is statistically significant when it isn’t, causing a Type 1 error.
Type II error: The exact opposite: when you fail to reject the null hypothesis when you should have. In simple terms, you conclude that there is no difference between the two LPs when one will actually perform better than the other, and you end the test early (false negative).
A Type II error occurs when the original LP (null hypothesis) would have been the winner if you had waited long enough.
Both errors generally happen when we end the test too early, with Type I being the most common. So don’t end a test too early!
Statistical Significance, Statistical Power, and their relationship
This is the point when most people start to get scared, but these concepts are simple if explained properly.
Statistical Significance: The probability of the data obtained not being due to chance.
What people need to know about statistical significance is that it doesn’t guarantee that your sample size is large enough to ensure your result is not based on chance. If I lost you there, fear not, here’s a quote by Evan Miller, blogger, software developer, and Ph.D. in economics, to help shed some light:
“When an A/B testing dashboard says there is a ‘95% chance of beating original’ or ‘90% probability of statistical significance,’ it’s asking the following question: Assuming there is no underlying difference between A and B, how often will we see a difference like we do in the data just by chance?”
If you set a confidence level of 5%, you’re saying that you’re okay with there being a 5% chance that the results you see are due to random chance. In other words, if you ran your test 100 times and got “significant” results in each test, 5 of your results would be due to randomness.
You don’t have to understand the exact math behind statistical significance, but you do have to understand that the calculation involves a predetermined sample size. Running a test until you see “statistically significant” without presetting a sample size is a waste of time.
By blindly trusting your A/B software to let you know when your results are significant, you carry a high risk of Type 1 errors because you likely don’t have significant results.
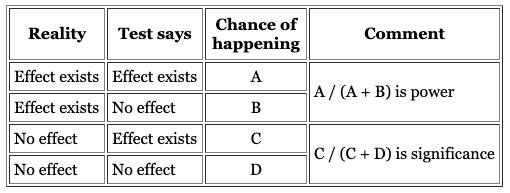
Statistical Power: The likelihood that your test will see an effect that is present (and avoiding a Type II error). It’s a term that gauges the sensitivity of your test.
If you want your new landing page to achieve a 10% relative increase in conversion rate, statistical power will tell you whether or not your test was able to detect that change. That 10% relative increase in conversion rate is called effect size. Naturally, the larger your effect size is, the easier it is to measure. You’ll find it easier to measure the difference between a 50% conversion rate and a 55% conversion rate versus trying to detect the difference between 10% and 11%. Both are 10% relative effect sizes, but one is a much bigger absolute effect size.
If you’re a runner like me, you know it’s usually much easier to tell who won a marathon than it is to tell who won a 100-meter dash for the same reason.
If your software or calculator uses Statistical Power (which many do not), and it is telling you that your results are statistically powerful, that means that your test was able to measure your desired effect at least 80% of the time (which is the standard measure for Statistical Power).
While Statistical Significance is the probability of seeing an effect when there isn’t one, Statistical Power is the probability of seeing an effect when there is one. Here is a chart summarizing the difference courtesy of Evan Miller:
If you want to reach an 80% Power level, there are a few levers you can pull to get there. The first lever is effect size, which we already covered. The larger your effect size, the more often your test is going to be able to detect it.
The second is your sample size. If you’ve appropriately chosen your sample size using a calculator, it should be big enough to get 80% Statistical Power. The idea here is that if your sample is large enough, you will have a higher chance of detecting your desired effect. Lastly, you can also increase the duration of your test. The same logic that applies to having a larger sample size also applies here. However, you shouldn’t let your test run too long, or you run the risk of sample pollution.
The first two levers mentioned, effect size and sample size, are the two biggest you can pull, and they are directly correlated. The smaller your effect size, the bigger your sample size must be to reach the desired Power and vice versa. The math can get a bit tricky, but all you need to know is that the standard Power is 80% in most widely available testing tools.
Achieving Statistical Power is just as important as achieving Statistical Significance. By reaching your desired Power, you reduce the risks of making a Type II error.
Margins of Error
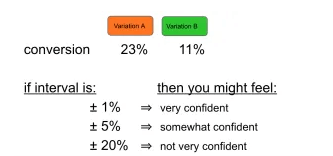
The margin of error (confidence interval) is displayed in most A/B testing digital marketing software. If you see your conversion rate is X% ±Y%, the “±Y%” is your margin of error.
A good rule-of-thumb is to keep testing if your margins of error overlap between tests. This means your results are likely not yet significant. The following image shows an example of how the conversion rate margin of errors may overlap.
If the interval is +- 1, it’s clear that A is winning, but if the interval is +- 20%, A could be 43% to 3%, and B could be 0% to 31%, and those percentages overlap.
The smaller the interval, the likelier the conversion rate you’re seeing is accurate. It’s another way to gauge the likelihood that the alternative hypothesis is actually winning.
Things to look out for
Now that you understand these terms, let’s dive into things you should look out for.
Novelty Effect
The novelty effect is the tendency for performance to improve at the start of a test only because the variant is new.
A common phenomenon you may notice when starting an A/B test is to see the results swing in one direction at the beginning of the test. You may be tempted to end the test there, but the fact is that tests swing in and out of significance throughout the duration of the test. Eventually, they regress to the mean (return to normal).
Here’s an illustration of this effect. A class of students takes a 100-item true/false test. Suppose all students choose random answers. You’ll expect the average to be 50%, of course, but some students will score much higher than 50 and some much lower than 50, just by chance. If one takes only the top scoring 10% of students and gives them the same test a second time, you can again expect the mean would be close to 50%. The “above average” students regresses back to the mean of 50% because their high scores on the first test were the result of random chance.
This illustration shows the importance of setting both a sample size and an end date. You will see swings because of randomness at the beginning of your test. However, that randomness is a big variable in the beginning when you’ve only tested, say, 10 people in 1,000. As the test progresses, the randomness has less of an effect. By setting a sample size in advance, you won’t get too discouraged or too excited early on during the test and potentially end it too early. Ending a test too early is a surefire way to choose the wrong winner. It’s important to wait until the test ends to determine which version is performing better.
Confounding variables
Another thing to consider is confounding variables. One downside of using website traffic as your sample population is that the data is non-stationary. Basically, your mean, variance, co-variances, etc. change on a day-to-day basis on your site. The nature of the web means you get different kinds of traffic on different days.
Referral visitors from social media may behave differently than visitors coming from a guest post or advertisement. Visitors visiting during a Black Friday sale may behave differently from visitors on a typical weekday. Even on a normal day, you can expect a certain amount of people who landed on your site for no discernible reason.
These differences make accurate A/B testing hard for marketers, but my point is still to make sure you have a large enough sample size. A large sample size takes into account the randomness of site traffic. As I mentioned earlier, it’s important to avoid the temptation to end your test early or make decisions too fast. Focus on KPI’s in Google Analytics, like CTR or conversion rate.
How to put all the pieces together
So the question becomes, how do you determine a proper sample size to reach statistical significance? Well, the answer depends on many variables, including how much traffic you can get, baseline conversion rate, what you set your confidence level at, what you want your Power to be, and more. Fortunately, there are multiple free calculator options online that can do the math for you, making it easier to make these determinations.
Simple statistic significance calculators like Neil Patel’s are good for retroactively seeing if your test won or not. But you shouldn’t use them while a test is running to determine a winner. You must decide the end date and how many visitors you need before you start the test. If you don’t wait until you’ve reached your sample size, that calculator is not a helpful tool in determining a winning version.
If you haven’t started your test yet, I recommend ConversionXL’s calculator. You can click on the pre-test analysis section and fill out a few variables so that the calculator can tell you how many weeks your test needs to run and what a good sample size would be to see minimal detectable effects. Always use this type of tool before starting so you can be sure you are getting a large enough sample size.
More data is usually better, but there are issues with sample pollution if you’re testing for too long. You don’t want to let in people you’ve already tested (returning visitors), and conducting your test during a holiday or holidays can introduce confounding variables that can affect your results.
So don’t test for too long. If you choose 4,000 visitors for your test and December 1 for your end date, it allows you to keep the ball rolling with all the tests you want to run rather than delay them indefinitely. You’re not in analysis paralysis. You get diminishing returns with the increased confidence you obtain.
Essentially, you’re looking for the Goldilocks zone where you don’t wait for too long or too short of a time (which is often the bigger problem). You want to test long enough to have a good sample size, but not too long, which may cause your online business becomes slow.
In summary, you can improve your accuracy when you’re conducting split testing for marketing by making sure you wait long enough before ending a test and calculating a decent sample size before testing. What was your favorite lesson learned from this article? Let me know in the comments.
Most newsletters suck...
So while we technically have to call this a daily newsletter so people know what it is, it's anything but.
You won't find any 'industry standards' or 'guru best practices' here - only the real stuff that actually moves the needle.


