The Breakdown: LinkedIn Launches Flowchart Reporting for New “Message Ads”
To keep up with competitors and trends, LinkedIn launched Message Ads (sometimes called Conversation Ads) a few months ago.
These ads are similar to Messenger Ads on Facebook and have a shorter word limit than LinkedIn InMail. Message Ads also offer multiple responses for prospects and marketers to choose from, like branching paths in a conversation.
When initially launched, Message Ads were missing a major functionality: reporting. While you could see engagement metrics for your ads, the platform’s limited reporting could mislead, as clicks and responses would count toward your click-through rate regardless of whether those users actually visited your site.
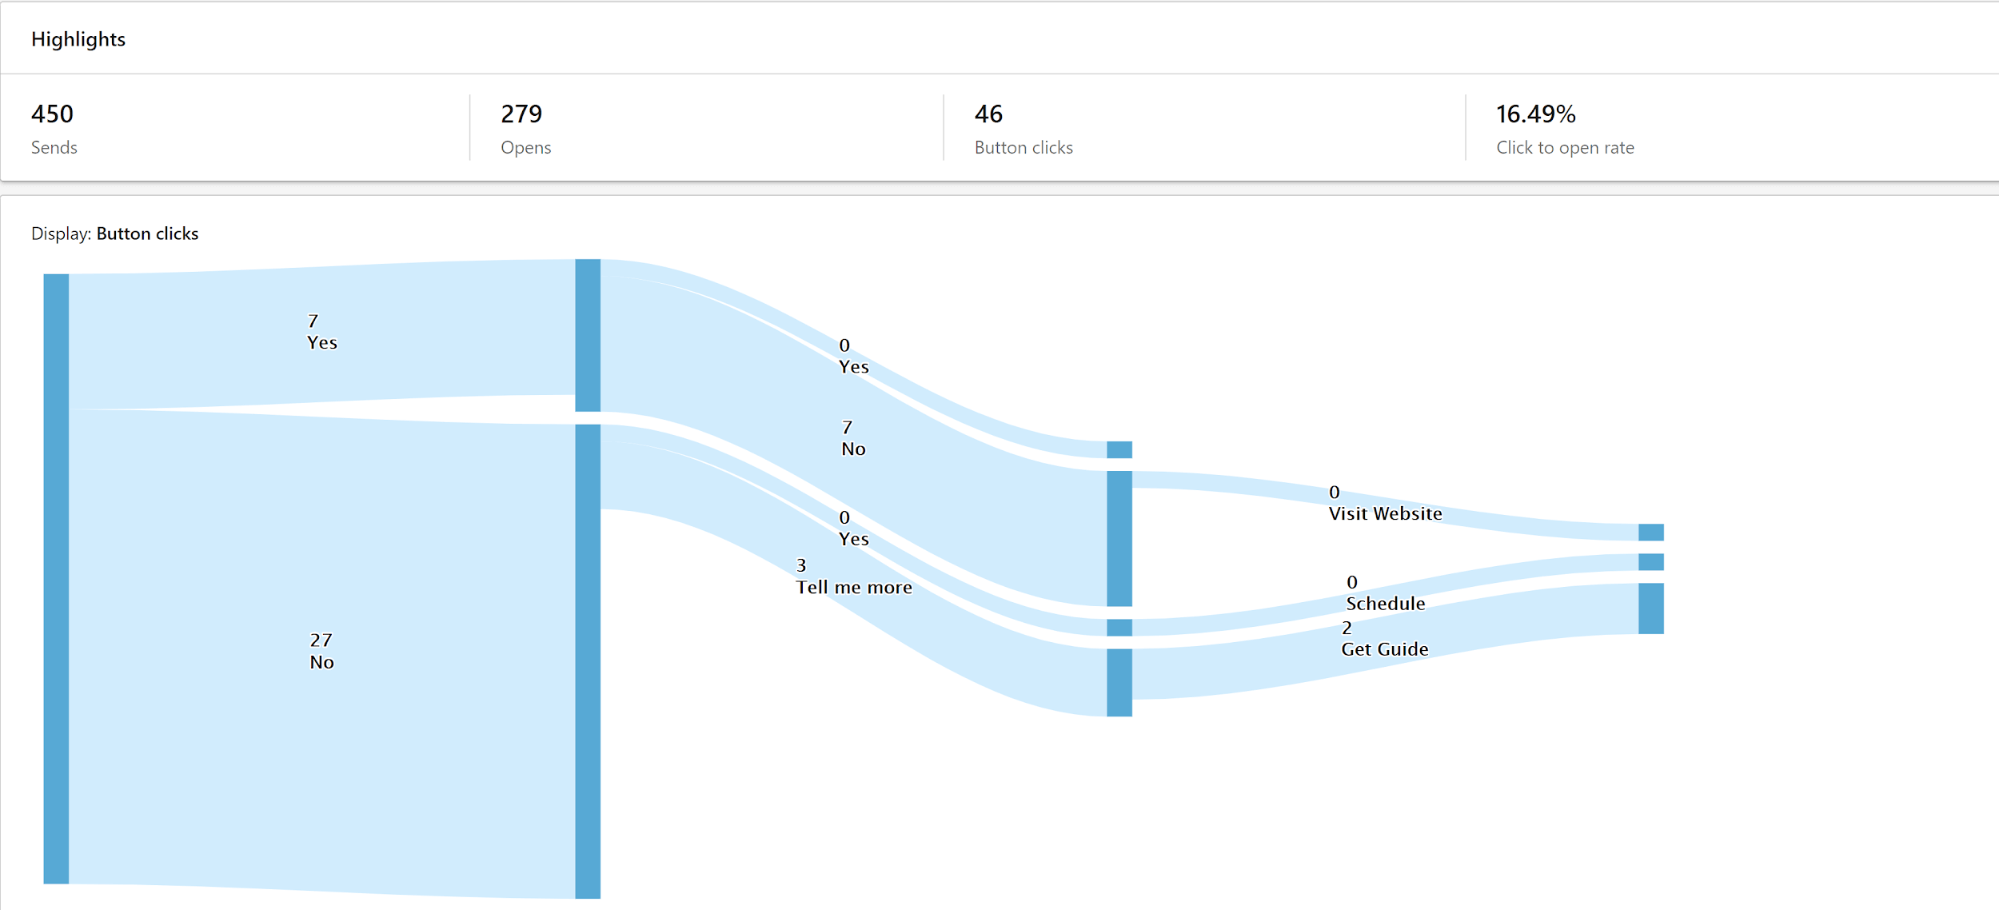
LinkedIn recently addressed this issue by releasing reporting flowcharts, which are exclusive to Message Ads. When you select one of your ads and click “Flowchart,” you’ll see a report similar to the Google Analytics Behavior Flow report. Here’s an example:

Now, advertisers can optimize their responses and intro messages accurately based on the response rates on LinkedIn. This data can help you understand where viewers are in your marketing funnel or what appeals the most to them. In this example, most prospects were not ready to schedule a meeting. Even so, the ads obtained leads from people who responded “no” by offering an ebook.
Most newsletters suck...
So while we technically have to call this a daily newsletter so people know what it is, it's anything but.
You won't find any 'industry standards' or 'guru best practices' here - only the real stuff that actually moves the needle.


